Frequently Asked Questions

About Us

We are a group of safety researchers and professionals focused on addressing the rising number of pedestrian and bicyclist fatalities.
NACTO img 2 NACTO img 2 NACTO img 3

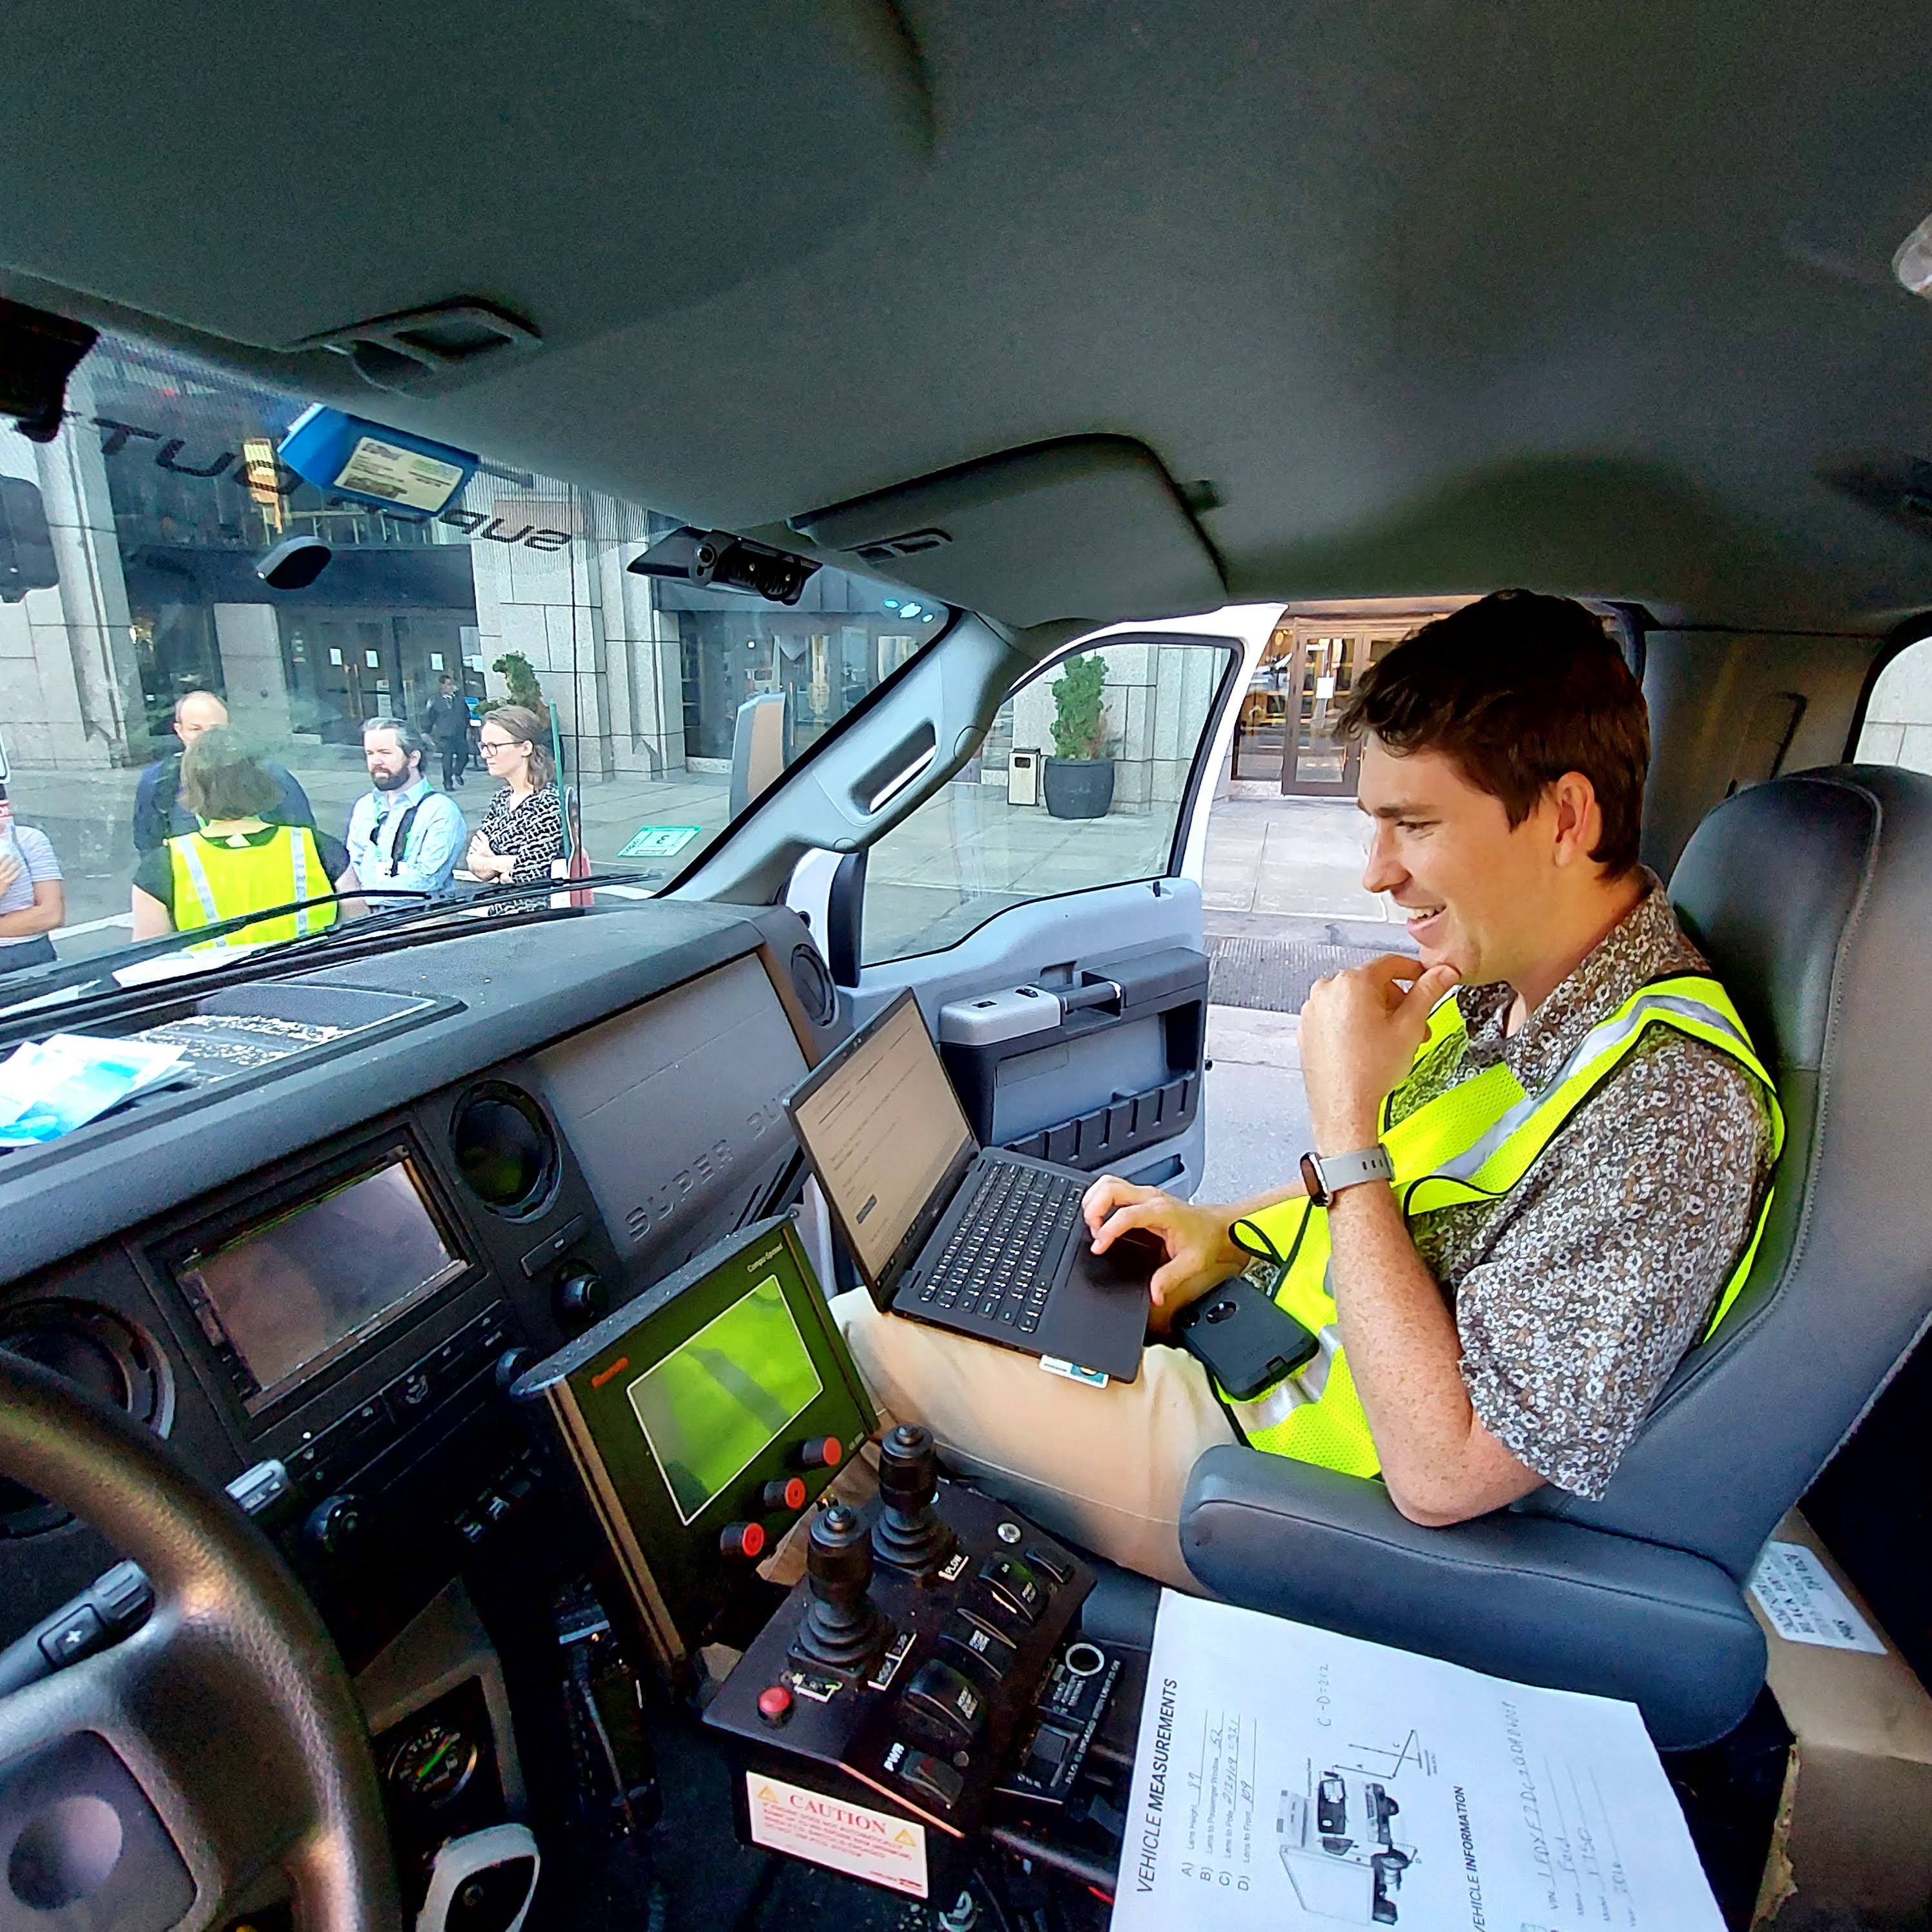
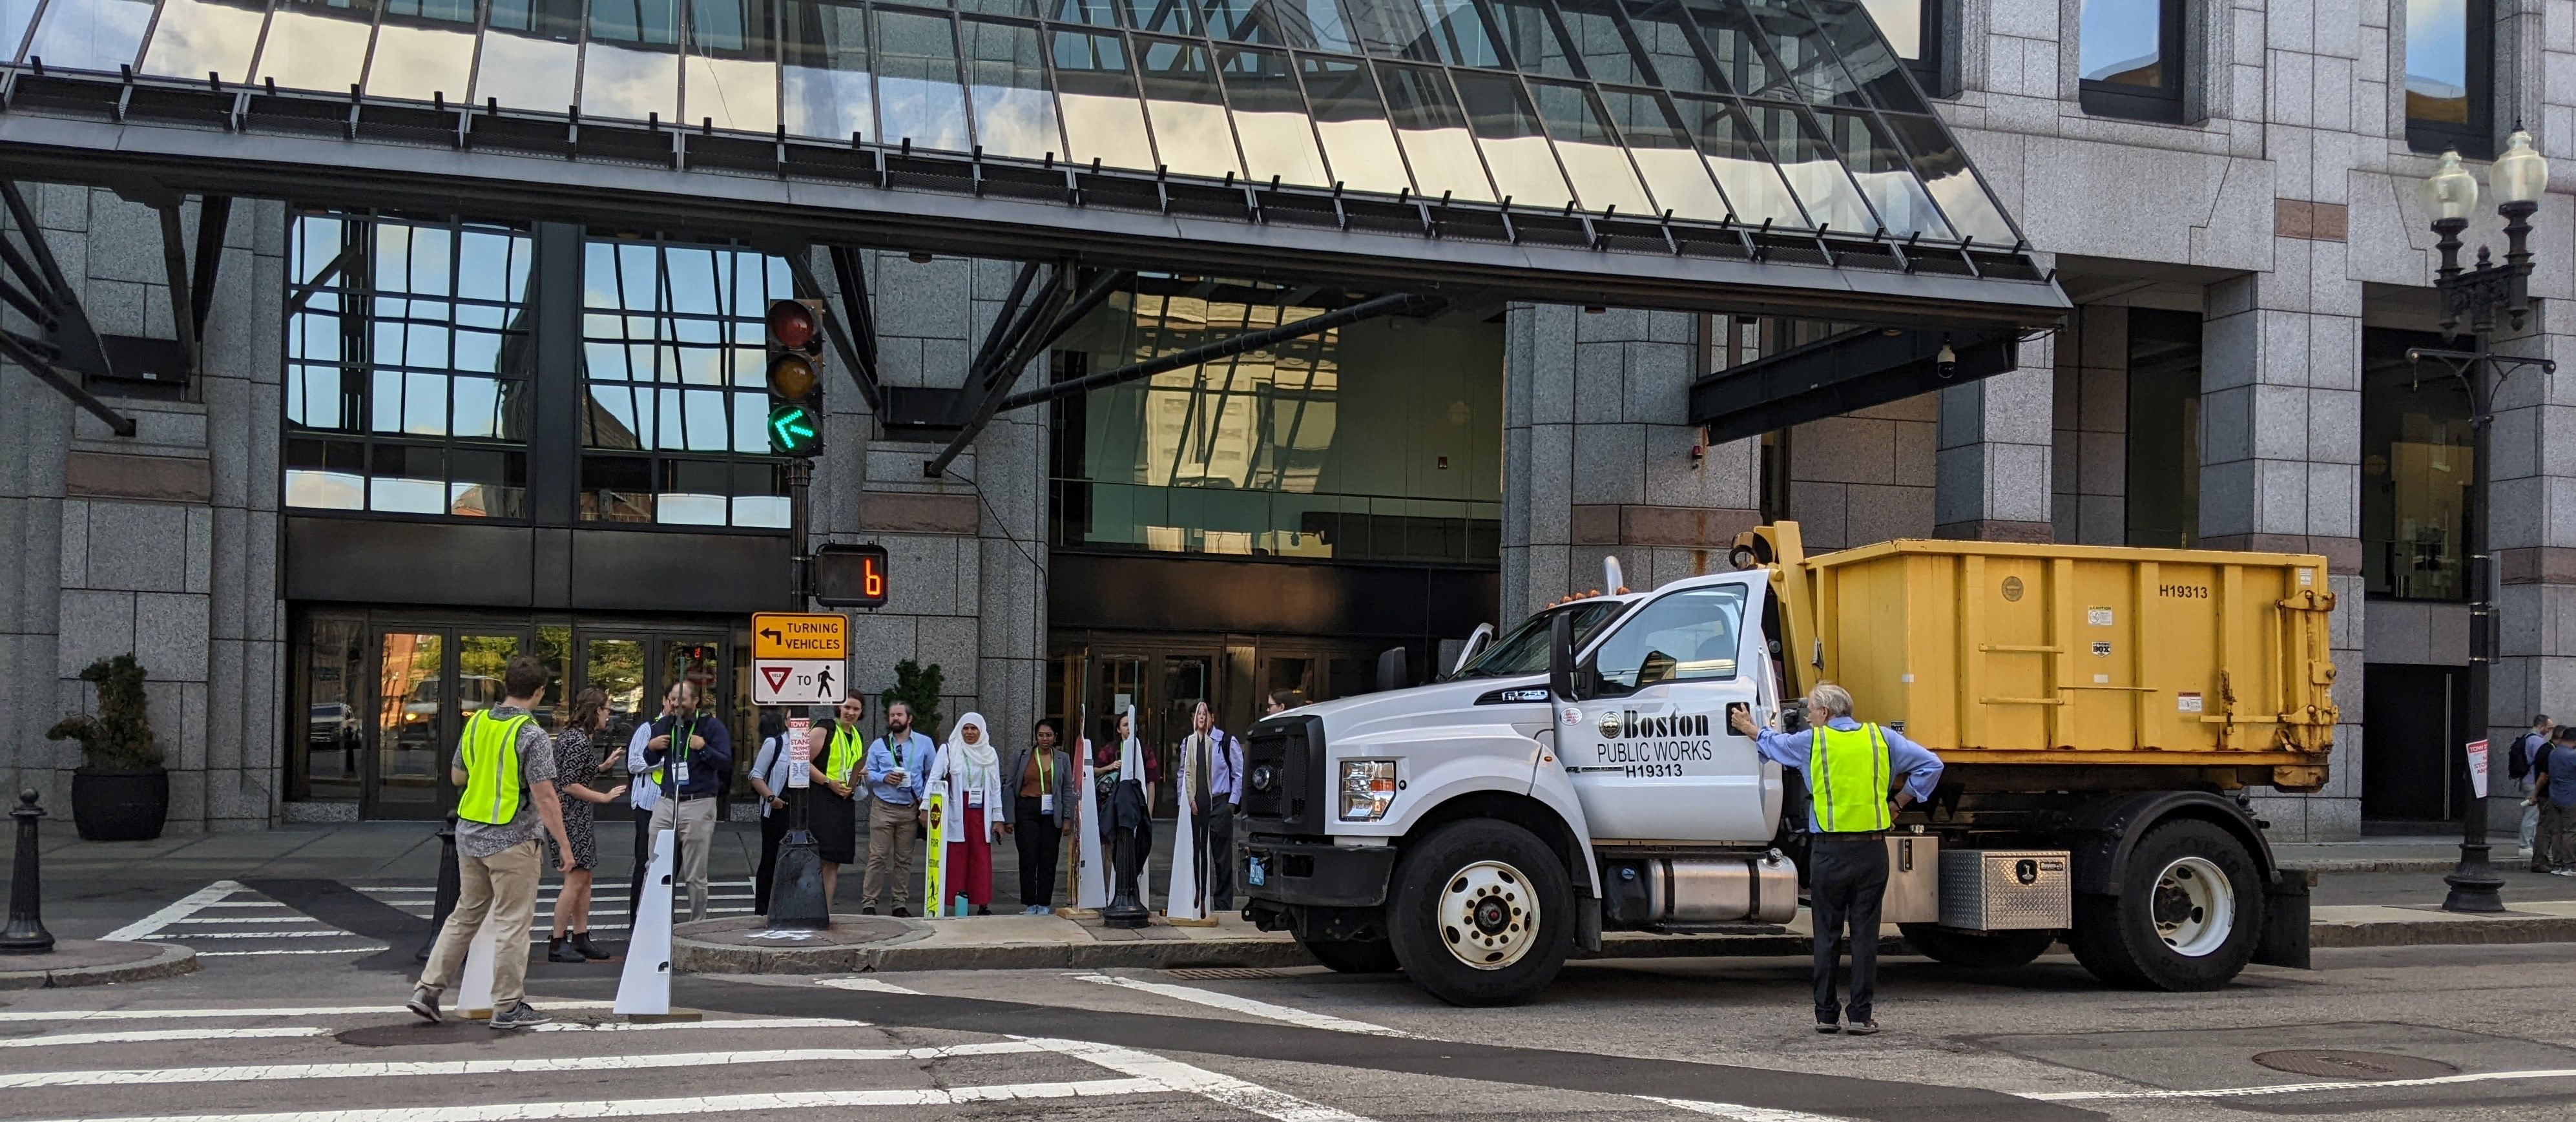
In partnership with Federal and non-Federal stakeholders, we aim to quantify and understand the safety impacts of large blind zones due to vehicle design and to inform Safe System Approach solutions to save lives.

Direct Vision and Blindzones

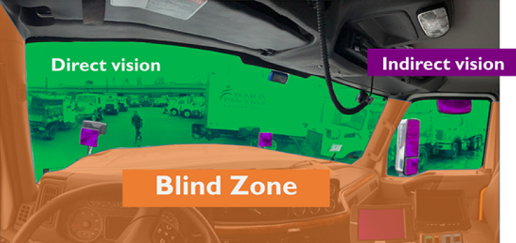
Direct vision is anything that can be seen by a driver directly - without the help of any device such as a mirror or a camera.
FAQ Direct Vision Image

Research shows that drivers respond 0.7 seconds faster with direct vision than with indirect vision. In addition, according to a study done by the University of Leeds, drivers react up to 50% faster to hazards in their direct vision compared to indirect vision. With these statistics, various authorities and industry organizations have increased their attention to direct vision as a derteminant of VRU safety.

A vehicle’s blind zone is the area around the vehicle that cannot be seen directly by the current driver. A blind zone can hold many vulnerable road users, increasing the crash risk. Larger and heavier vehicles like trucks tend to have larger blind zones than smaller vehicles, like passenger cars.
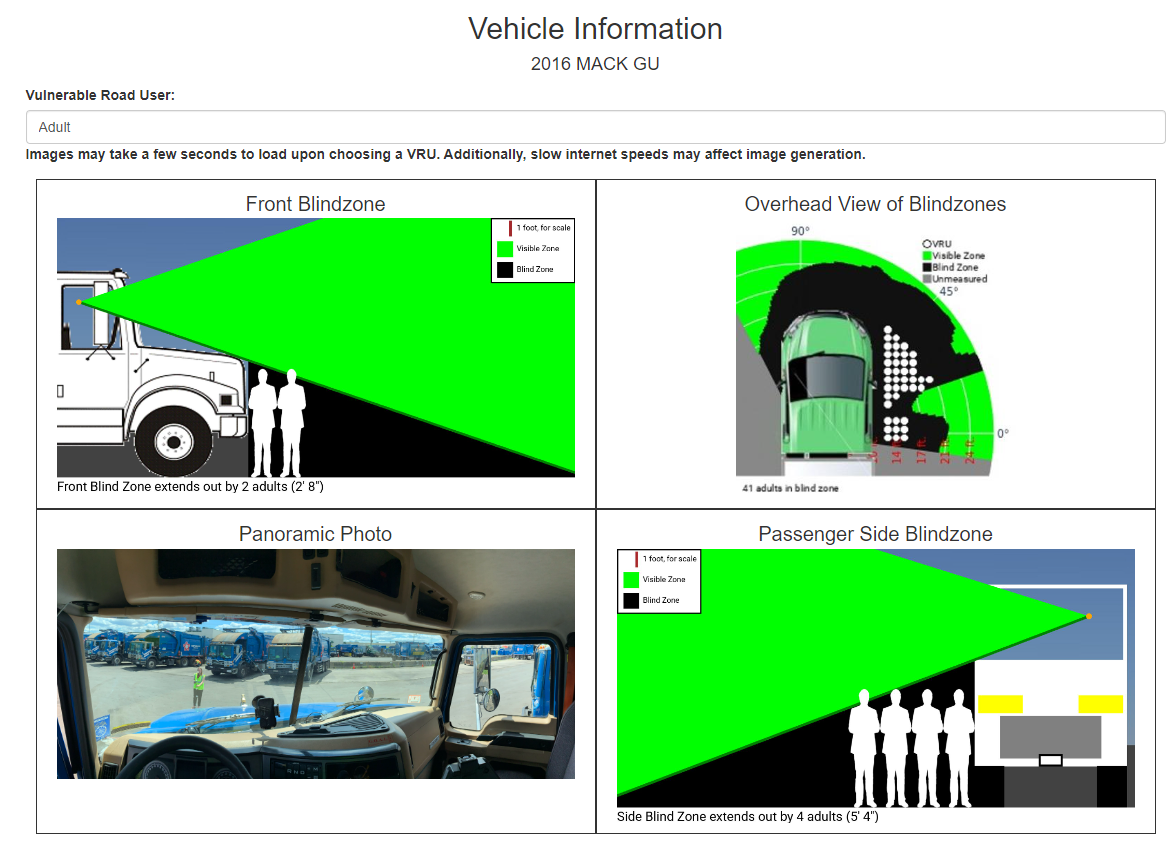
FAQ Blind Zone Image

Vulnerable Road Users include pedestrians, cyclists, and people who use wheelchairs. In 2021, they accounted for approximately 20% of the 42,915 people who were killed in motor vehicle crashes. These fatalities have increased by 13% since 2020, according to the USDOT Federal Highway Administration.

This Website

The VIEW application is a website which aims to create a crowd-sourced database that documents the blind zones of different cars and trucks. Our goal is to raise awareness about blind zones among consumers, from individuals buying a passenger car for themselves, to fleet managers looking to buy safer trucks for a whole city.

Anyone who is looking into acquiring a vehicle or is interested in our results can browse the "Visualize" tab. In addition, if you have access to a vehicle, feel free to add it to our database.

This site is an on-going project and is therefore constantly being upgraded on. The VIEW app contains baseline features and functionality, including calculations of percent visibility from the driver's seat in the front and side directions. More recently, we have added data visualizations and some blind zone visuals. They are visible on the "Visualize" tab and after adding a vehicle, respectively. We always welcome feedback about this version, and look forward to the opportunity to grow and expand this site. (Our contact information can be found below)

Measurements

A vulnerable road user is considered invisible if a driver cannot see their head and shoulders. The shoulder heights of 5th percentile United States female vulnerable road users are used in this calculation.

By type of VRU currently assessed in the VIEW app, the height measurements to the shoulder are:

  • preschool child – 28 inches
  • elementary school child on bicycle – 35 inches
  • elementary school child – 37 inches
  • wheelchair user – 39 inches
  • adult – 49 inches.
  • Specific Pages

    To add your vehicle, all you need is a phone, a tape measure, a 5-foot tall pole, and 20 minutes of your time. The “Add Vehicle” page of our website contains text instructions and a video to help you input your vehicle.

    Each table row has data points for an individual vehicle entered into our database. Body class and weight class are convenient ways to separate vehicles by purpose - body class categories include passenger vehicles, SUVs, minivans, vans, pickup trucks, commercial trucks, and buses. Both data elements are usually populated by vehicle ID number (VIN) lookup when the vehicle is added to the database.

    The VIEW app is a crowdsourced database to which multiple different users can add data and can add multiple entries for the same make and model, tailored to their unique driving position and eyepoint in the vehicle. Multiple measurements can provide a distribution of blind zone size for unique vehicles and contribute to confidence in the results. Although most drivers will adjust their seats to a comfortable location that places their eyepoint in a similar location (as described by the SAE J941 eyellipse), VIEW app outputs are generally specific to the drivers performing the input process. For standardized measurements representative of the vehicle blind zone for a standardized driver size and seat position, a standardized camera rig may be used (see FAQ above).

    Please contact blindzoneapp@dot.gov if you have any other questions or concerns, or if your organization is interested in working with us.